Guides
What 9,517 Norwegian accessibility statements reveal
An analysis of 9,517 completed accessibility statements in Uutilsynet's open dataset: declared status, freshness, and the WCAG criteria most often reported as non-conforming.
By Eivind Pihl Martinsen, Synli.aiLast updated September 25, 2026
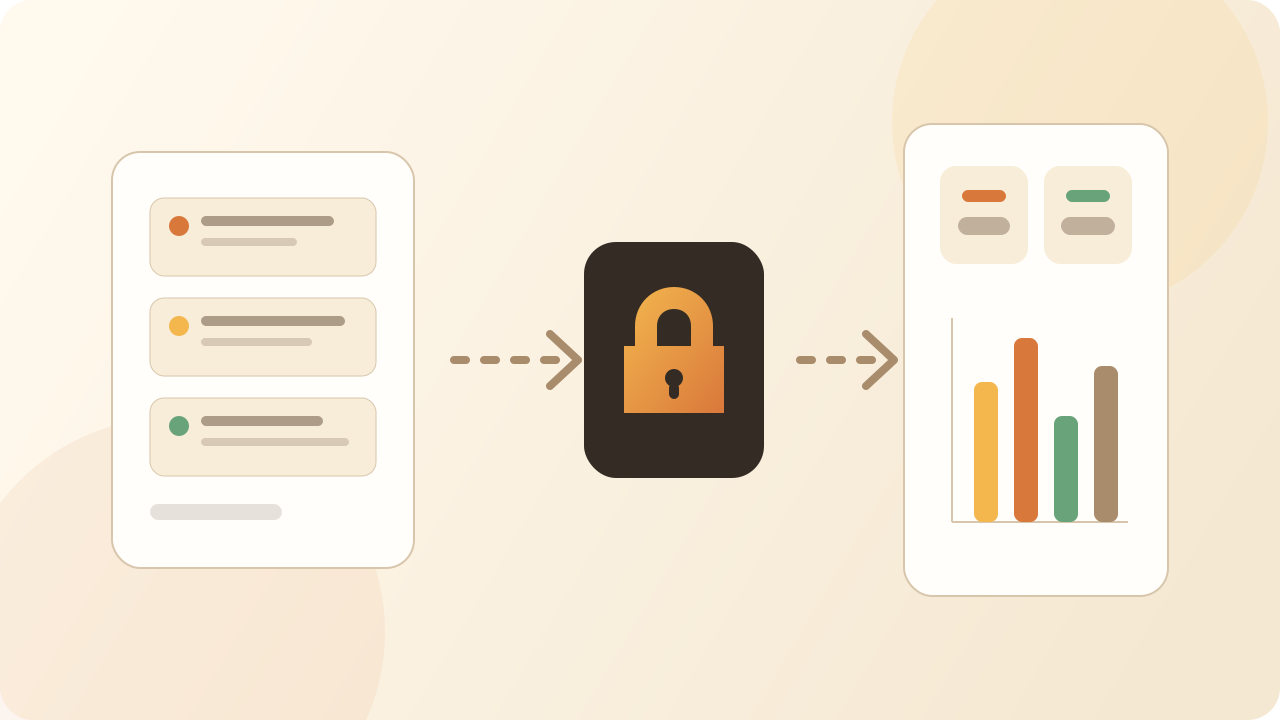
In 2026, Uutilsynet opened a machine-readable dataset containing every completed Norwegian accessibility statement. Our snapshot covers 9,517 statements from 1,325 unique organisation numbers. That makes pattern analysis possible without ranking individual organisations.
Four headline figures
- Completed statements
- 9,5178,795 websites · 722 apps
- Unique organisation numbers
- 1,325The Synli aggregate publishes the count only
- Updated within the last year
- 52.8%5,026 statements
- Declared criterion breaches
- 62,998Sum of the source talBrot field
2,215 statements (23.3%) say “in conformance”, 7,280 (76.5%) say “partially conforming”, and 22 (0.2%) say “not conforming”. These are self-declared statuses, not independent certification.
The WCAG criteria most often declared non-conforming
The table ranks criteria by the number of statements answering no. The share uses statements that answered yes or no for that criterion. Not-relevant answers remain available in the JSON aggregate but stay outside the percentage denominator.
| WCAG criterion | Declared breaches | Assessed | Breach share |
|---|---|---|---|
| 1.1.1 — Non-text Content | 3,837 | 9,033 | 42.5% |
| 1.3.1 — Info and Relationships | 3,557 | 9,356 | 38% |
| 1.4.3 — Contrast (Minimum) | 3,117 | 9,437 | 33% |
| 2.4.7 — Focus Visible | 2,752 | 9,381 | 29.3% |
| 4.1.2 — Name, Role, Value | 2,743 | 9,228 | 29.7% |
| 2.1.1 — Keyboard | 2,508 | 9,361 | 26.8% |
| 4.1.1 — Parsing | 2,472 | 9,190 | 26.9% |
| 1.4.11 — Non-text Contrast | 2,451 | 9,075 | 27% |
| 1.4.12 — Text Spacing | 2,334 | 9,106 | 25.6% |
| 2.5.3 — Label in Name | 2,219 | 8,819 | 25.2% |
What this means for prioritisation
- Non-text content, semantic structure, contrast, component names and visible focus recur. They deserve permanent checks in design, development and editorial workflows.
- Automate what can be measured reliably, but keep human review for areas such as alternative-text quality, meaning, keyboard flow and representative user tasks.
- Treat the accessibility statement as maintained evidence. 52.8% of statements in this snapshot are marked updated within the last year.
- Prioritise using your own findings and current solution state. National patterns are context, not a substitute for testing.
Method and reproducibility
- The snapshot was retrieved on 2026-09-25 from Uutilsynet's open JSON endpoint. Every content page was fetched and checked against the total before the aggregate was written.
- Headline totals use the source talSamsvar, talBrot and talIkkjeRelevant fields. The criterion table uses oppfyllerAltInnhaldKravet; breach share is no divided by yes plus no.
- Organisation names, web addresses, organisation numbers, statement IDs and free-text details are omitted from the public Synli aggregate.
- The snapshot can be rebuilt from the repository with pnpm --filter @synli/landing refresh:uutilsynet. The production build does not call the external API.
FAQ
Are these regulatory audit or automated-test results?
No. The figures are aggregated from completed accessibility statements, which contain organisations' own declared status. They are not Uutilsynet inspection findings, a representative national survey, or a new Synli scan.
Why does the assessed-statement denominator vary by WCAG criterion?
A requirement can be marked not relevant, and website and app statements do not use exactly the same requirement set. The table therefore divides no answers by yes plus no for each criterion; not-relevant answers stay outside the denominator.
Are the figures updated in real time?
No. Uutilsynet describes the source dataset as updated daily, while this page uses a controlled snapshot retrieved on 2026-09-25. The visible snapshot date keeps each figure auditable.